VantagePoint™ Dashboards by Lonrú Studios™
See Your Data. Own Your Insight.
Stop relying on static reports. We build custom, interactive dashboards that turn complex datasets into reactive decision-making tools - without expensive licensing fees.
Introduction to VantagePoint™ Dashboards
See Your Data. Own Your Insight. Custom VantagePoint™ Dashboards are our answer to a universal challenge: static reports that fail to capture dynamic realities. VantagePoint™ brings together secure data integration, transparent SQL logic, and modern interface design to illuminate opportunities in real time.
Our dashboards are built to be reactive applications. Every filter, chart, and data point interacts seamlessly with the rest, allowing you to explore your data dynamically rather than passively viewing it.
Powered by Lonrú Studios™
Lonrú Consulting created Lonrú Studios™ as our dedicated engineering and product development hub. While our consulting practice focuses on high-level strategy, Lonrú Studios™ executes that vision. This is the same technical engine that incubates our own internal ventures and digital products. We don't just build tools for clients; we build with them every day.
We Combine:
Direct Data Integration: Secure connections to public databases (like ClinicalTrials.gov) or your own internal SQL/Cloud infrastructure.
Transparent Analytics: We use clear, SQL-driven logic to ensure accuracy and reproducibility - no "black box" calculations.
Bespoke Interfaces: Custom-built UIs that fit your specific workflow, ensuring you aren't forced into rigid, off-the-shelf templates.
When to Choose Custom?
Our clients partner with Lonrú Studios™ when:
Standard Tools Hit a Wall: Platforms like Tableau or Power BI become too expensive at scale or too limited in design flexibility.
Complexity is High: They need a bespoke solution to handle multi-layered data in high-stakes environments.
Speed Matters: They need a functional, fast, and flexible tool that supports rapid decision-making.
We build dashboards that are:
Securely Connected: Live links to your data sources.
Reactive Web Applications: No more loading screens between views. Every filter instantly updates the entire dashboard state.
Vendor-Independent: You aren't renting your insight.
Examples
Below we’ve included live examples so you can see the difference yourself:
A Lonrú Studios™ custom-built reactive CRISPR dashboard:
Designed to showcase how a dashboard should feel when it’s interactive, intuitive, and deeply connected to the underlying data.Examples of Tableau dashboards:
While Tableau remains a strong option, it comes with expensive licenses and limited customization. If you want to stick with Tableau, we also support and design within that ecosystem - but we’ll show you why many clients are moving toward bespoke builds with Lonrú Studios™.
A Note on Ownership
Every dashboard from Lonrú Studios™ is:
Custom-Architected: Built without reliance on expensive per-user licensing fees.
Scalable: Designed to grow with your data, not slow down.
Yours: We believe you should own your tools. We design for seamless integration into your existing systems, ensuring you retain control over your data and your insights.
Examples of Our Work
Below, we have included live examples to demonstrate the power of a reactive build.
VantagePoint™ Custom Build (CRISPR Dashboard): While this example visualizes complex Life Sciences data, it demonstrates a universal capability: the ability to handle large, intricate datasets with speed and clarity. Experience how a dashboard should feel when it is intuitive and deeply connected to the underlying data.
Tableau and PowerBI Implementation: We understand that for many internal reporting needs, Tableau and Power BI remain a standard. We support and optimize within that ecosystem, but the comparison below highlights why many innovative leaders are moving toward the flexibility of bespoke builds with Lonrú Studios™.
Tableau Dashboards
Best Viewing Experience for Dashboards
For the best experience, we recommend viewing these dashboards on a larger screen (17" display or bigger, with a resolution of 1920x1080 or higher). While they are responsive, a fullscreen view allows for clearer visuals and smoother interactivity, making data exploration easier. Click the "View Fullscreen" button below each dashboard or click on the fullscreen icon for the optimal experience.
UK Cell and Gene Therapy Clinical Trials Overview
Unlock insights into the evolution of CGT trials in the UK*.
Explore the trends in cell and gene therapy clinical trials in the UK over time. Compare growth patterns and identify peak innovation periods by hovering over yearly data points.
*Data sourced from CGT Catapult UK Clinical Trials Database. Data cut-off: December 31st 2024
Dashboard is best viewed in fullscreen.

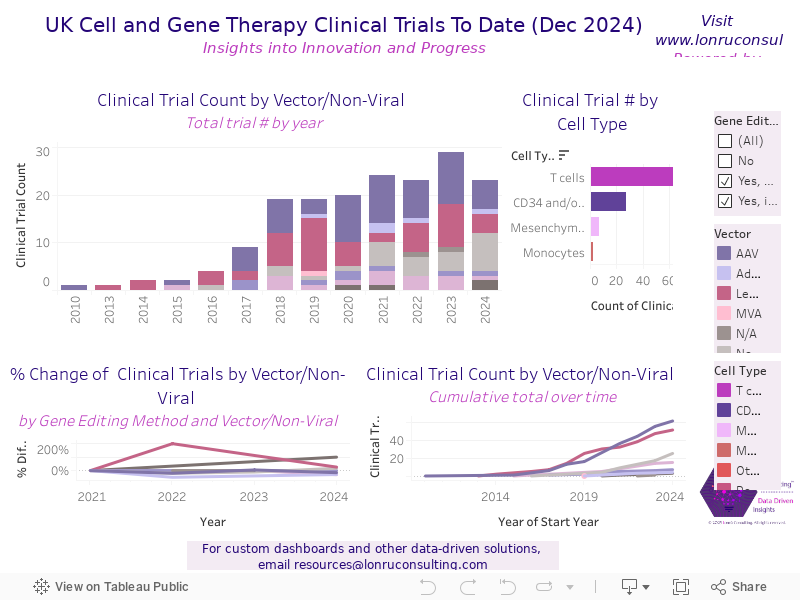
Clinical Trials by Cell Type, Vector or Other Engineering Method
See how cell and gene therapy approaches have shifted over time.
Investigate the distribution of trials based on vector types and gene editing methods. Analyse the percentage changes year over year and uncover emerging trends in non-viral versus viral vector usage.
Dashboard is best viewed in fullscreen.
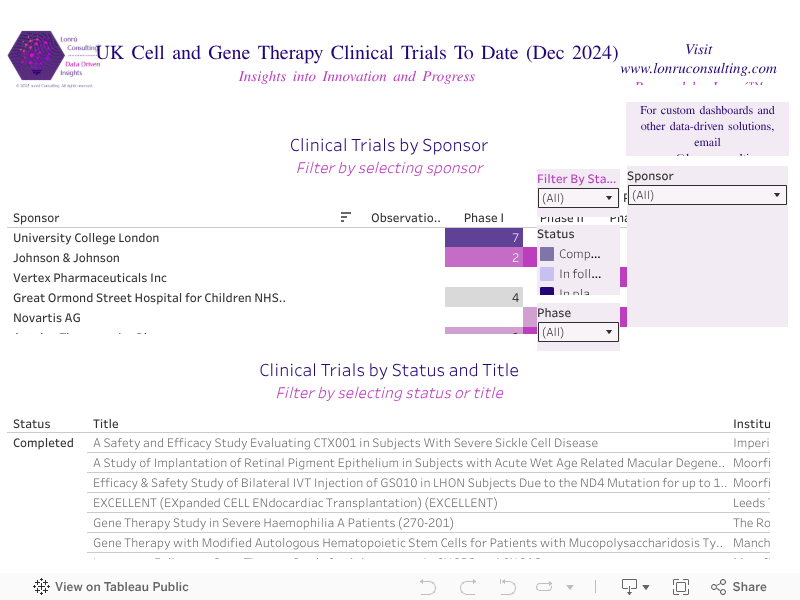
Clinical Trials by Sponsor and Status
Discover who is driving cell and gene therapy innovation.
Filter by company or institution to see trial activity from major players like Vertex, Novartis, and Moderna. Identify which sponsors have the most active, completed, or in-progress trials.
Dashboard is best viewed in fullscreen.
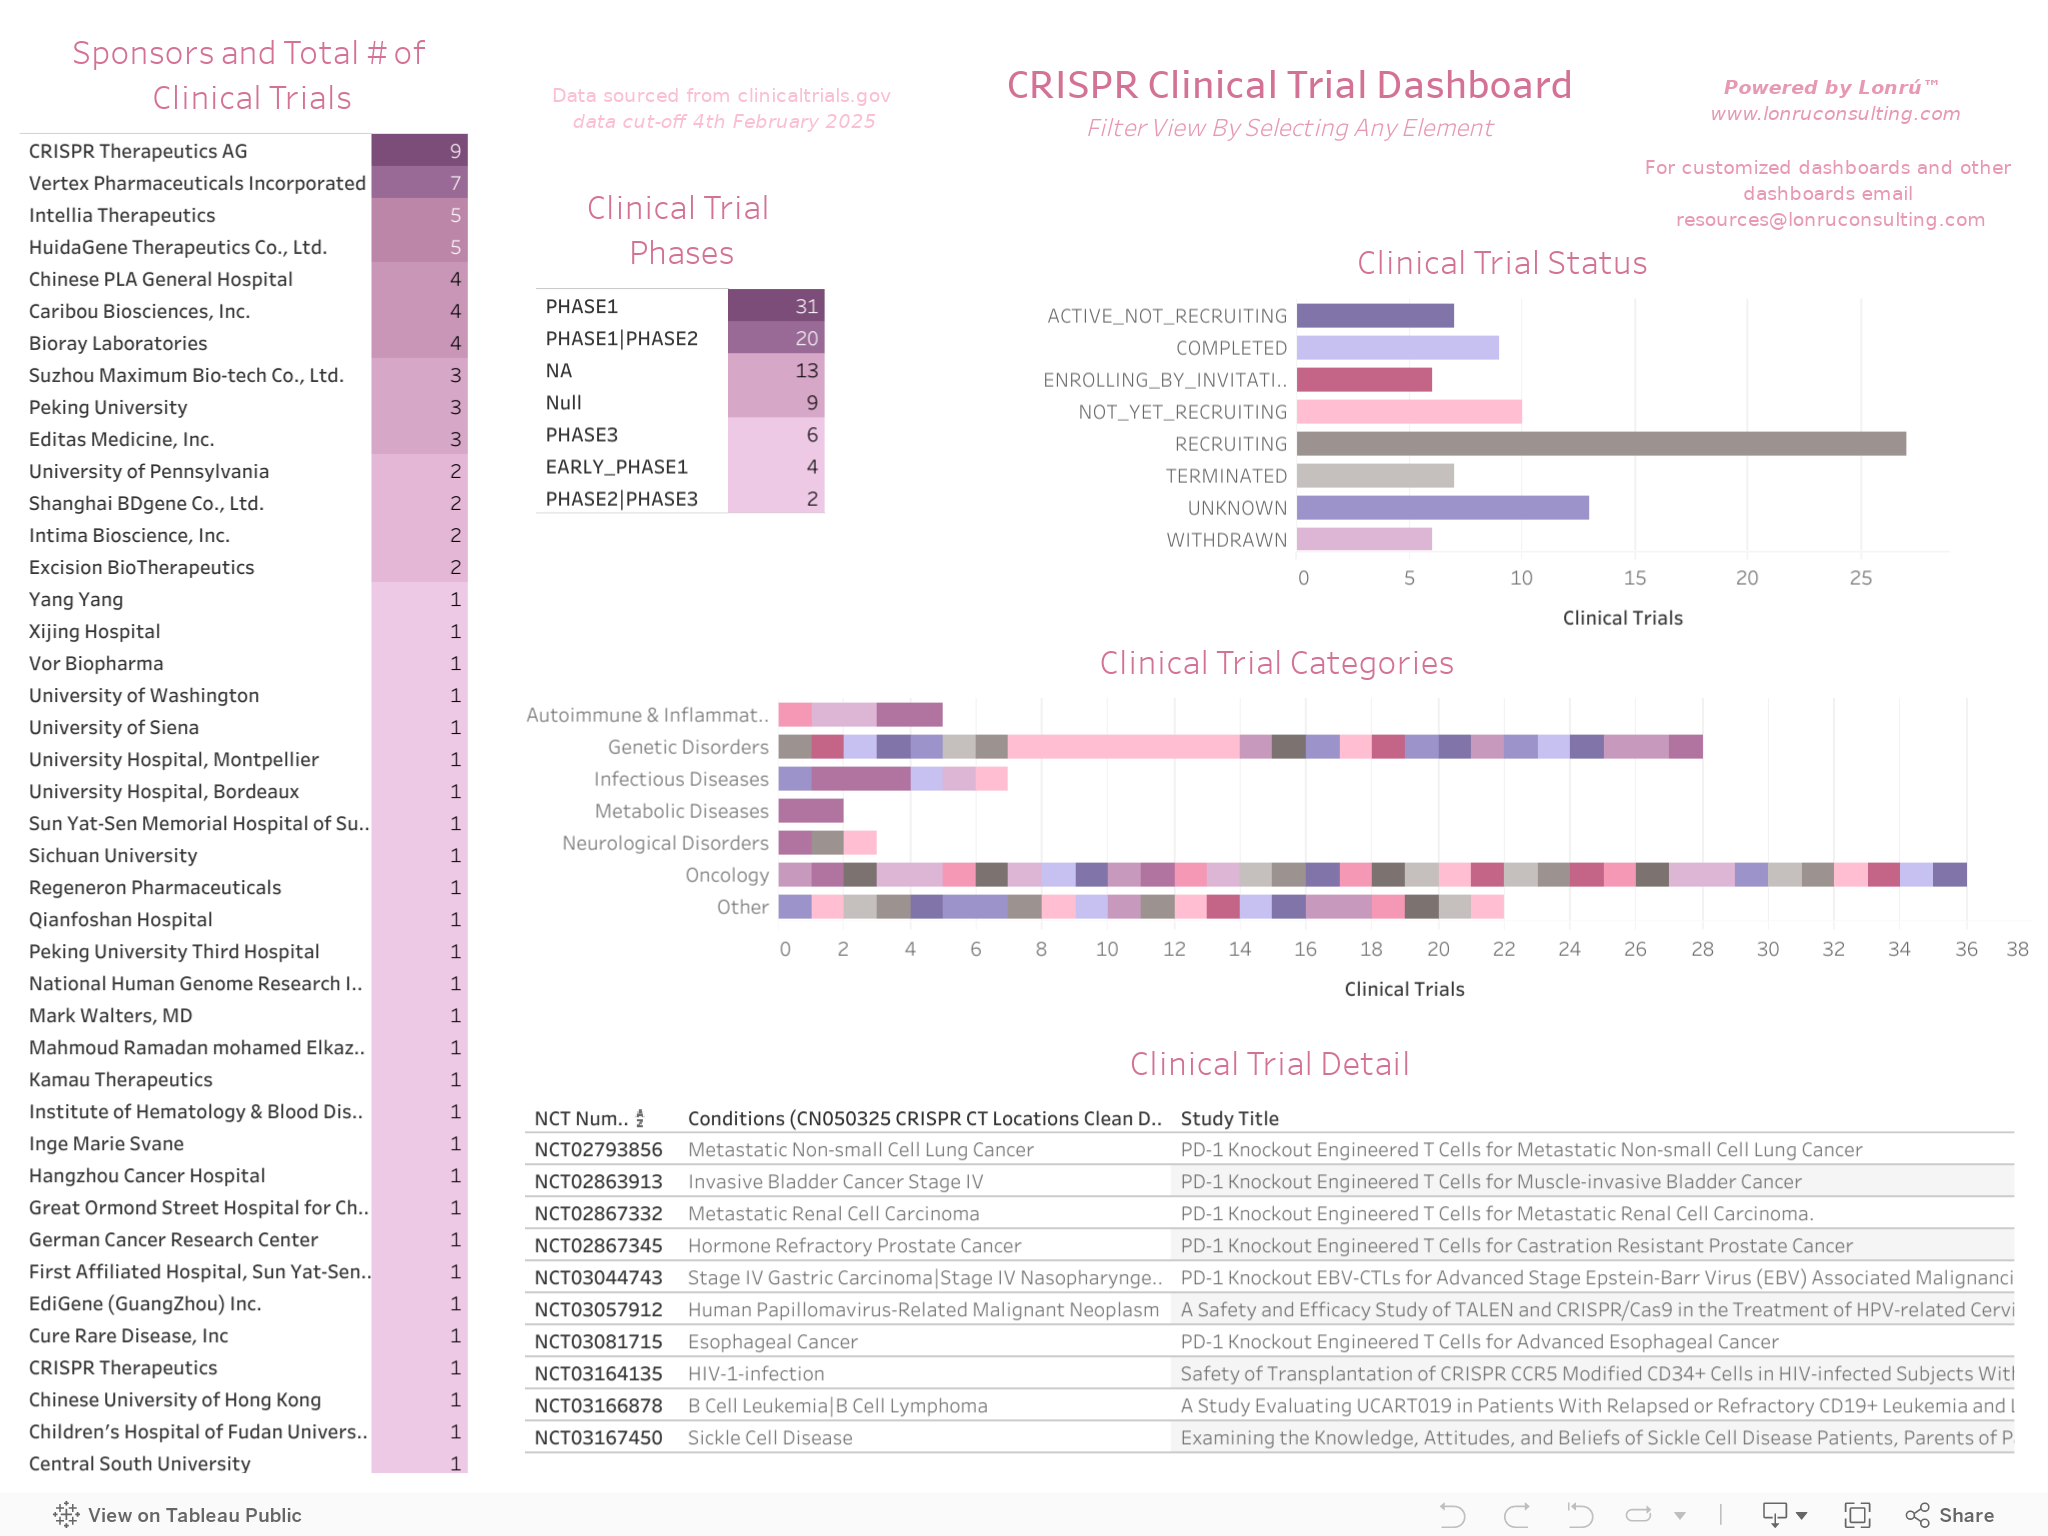
CRISPR Clinical Trial Dashboard
CRISPR Clinical Trials by Sponsor and Status
Discover who is reshaping genomic medicine with CRISPR technologies. Filter by sponsor or trial status to explore key players—like CRISPR Therapeutics, Vertex, and more—and see which studies are active, recruiting, or completed. Identify rising innovators and track the most promising breakthroughs in gene editing.
*Data sourced from clinicaltrials.gov Data cut-off: February 4th 2025
Dashboard is best viewed in fullscreen.